
Incident postmortem: our August 13–14 service outage
How a database I/O spike hit our Convex guardrail, GitHub Actions slowed the recovery deploy, and what we are changing after the outage.

Posted by Jesse Peplinski
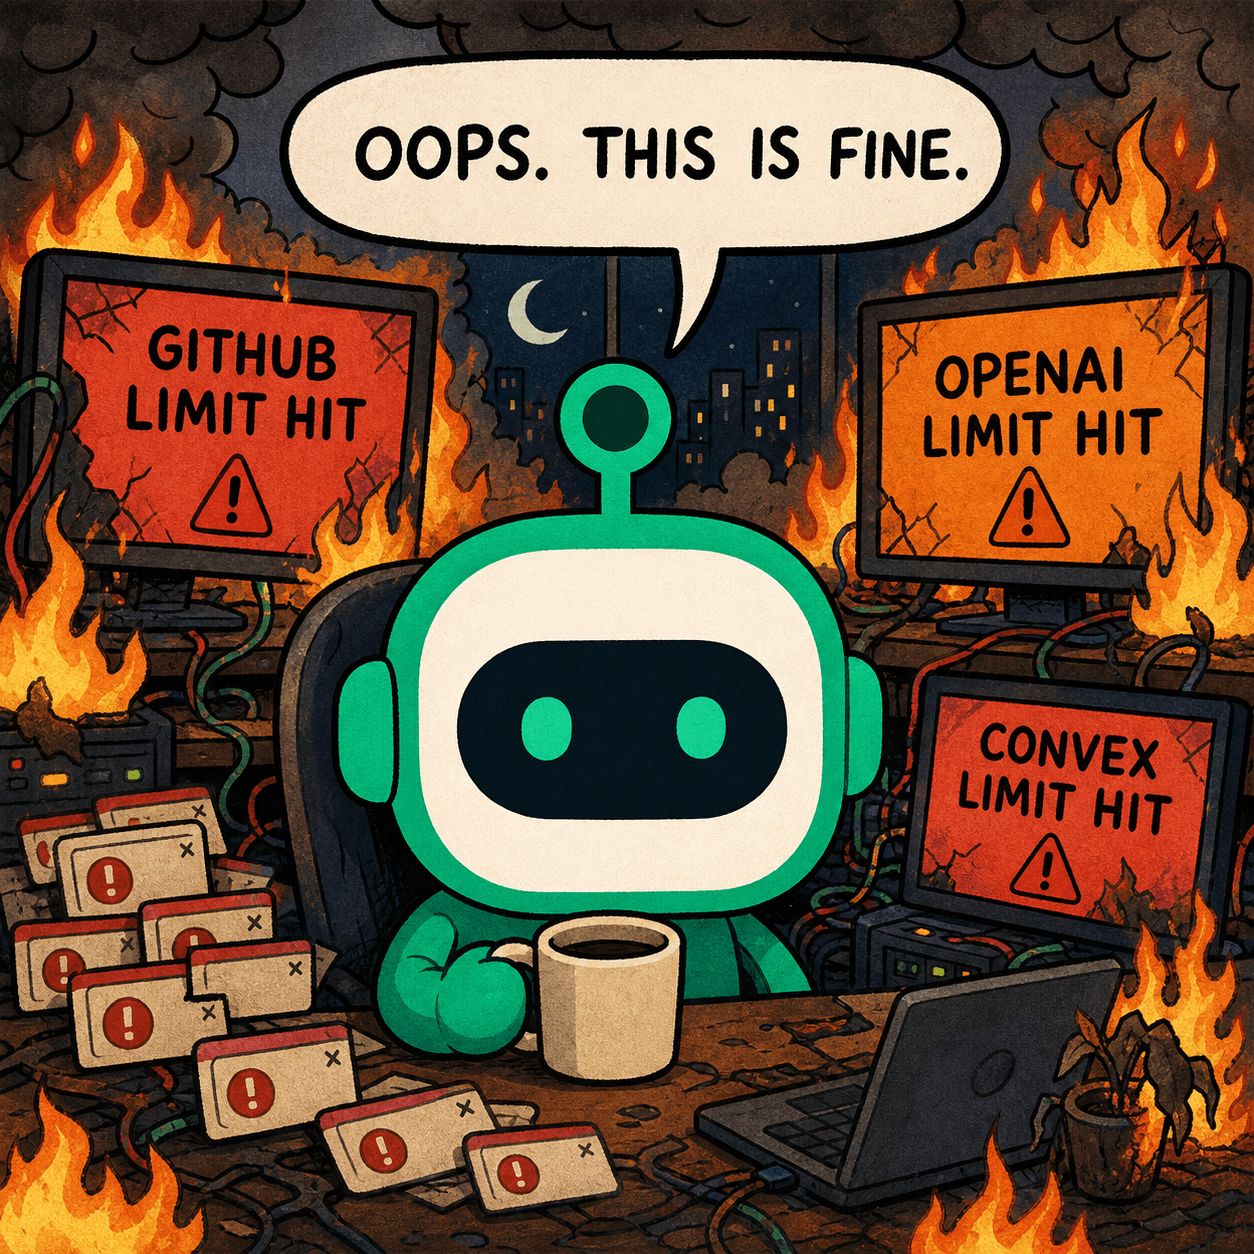
What users experienced.
We first confirmed the outage at approximately 8:00 PM ET on August 13. We know the app was unavailable for at least three hours, but we did not have external uptime monitoring in place, so we cannot verify the exact start time, recovery time, or total duration.
The app was working again when we checked shortly before 5:00 AM ET on August 14. We sent Convex a support request but did not receive a reply during the incident. At some point while we were waiting, the deployments were re-enabled. Our marketing site remained online, but the backend that powers sign-in, dashboard data, and automated jobs was unavailable during the outage.
Why the timing hurt.
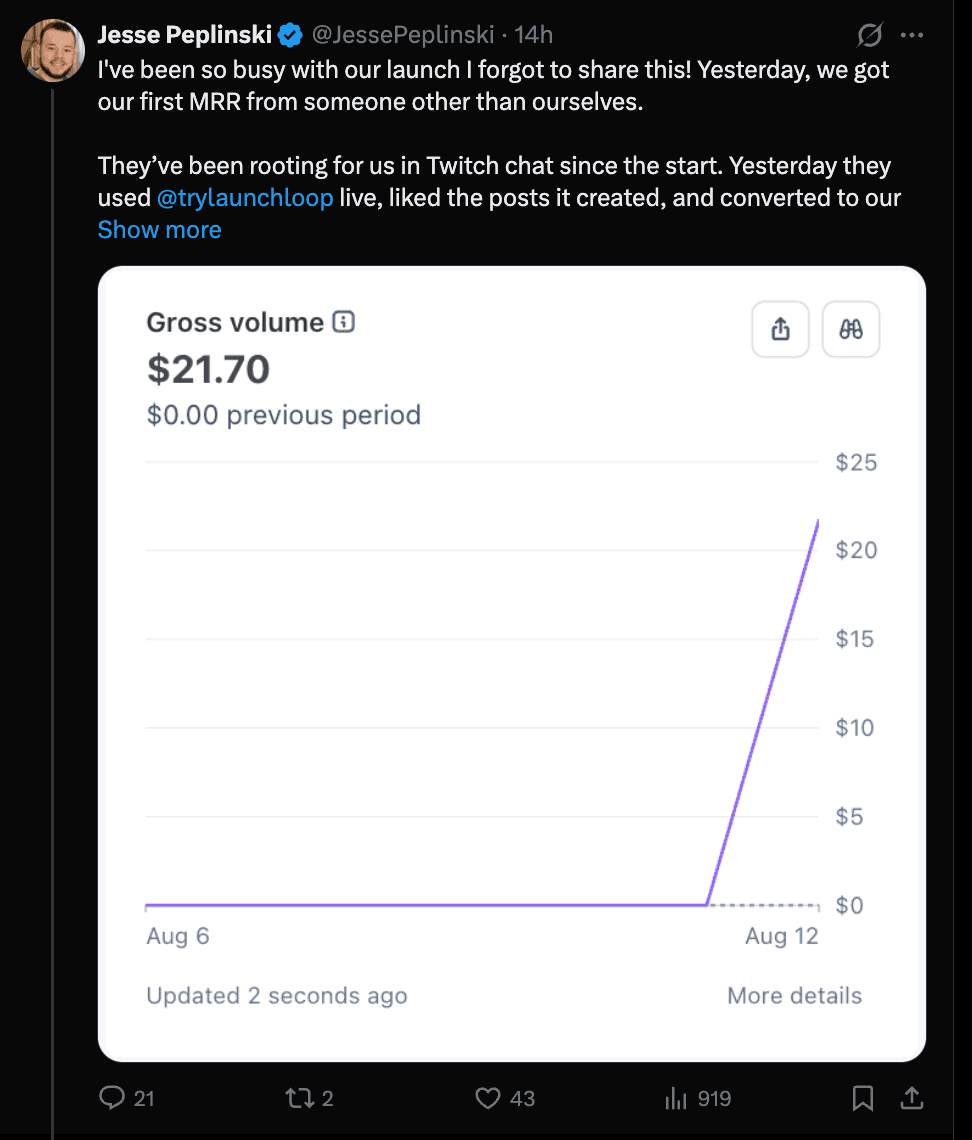
The timing made the outage especially frustrating. Earlier that week, we received our first monthly recurring revenue from someone outside the team and shared that milestone publicly. That announcement likely brought new people to TryLaunchLoop at exactly the moment the product became unavailable.
We cannot know how many people tried the app during the outage or whether any of them would have converted. We do know that anyone who visited could not properly evaluate the product. Our first real customer momentum and our first major availability incident landed in the same week. It was bad timing, and it raised the cost of being slow to detect the outage beyond the infrastructure bill itself.
What caused the outage.
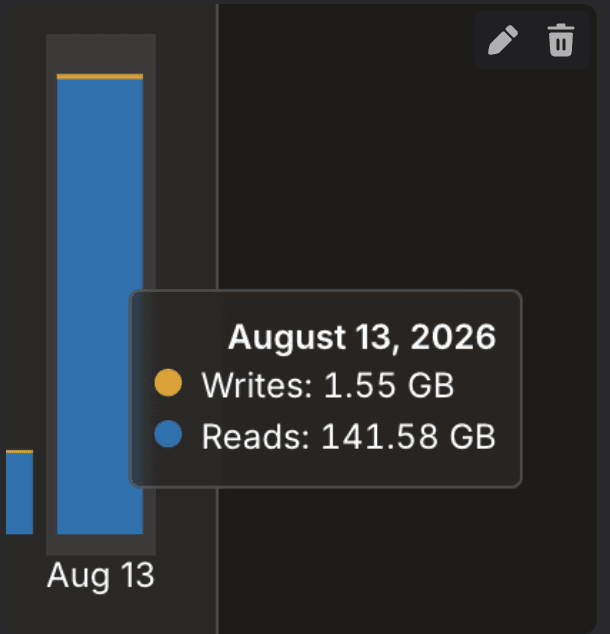
A recently expanded internal jobs dashboard subscribed to broad, reactive job queries. At the same time, job records were being updated frequently by runner heartbeats and dispatcher polling. Each update could cause those large queries to run again, even when nobody needed the full history.
That feedback loop drove the billing period's database I/O to roughly 175 GB. About 98.5% of it was reads, which matched the repeated-query failure mode rather than a large volume of new data being written.
The Convex spending limit did its job.
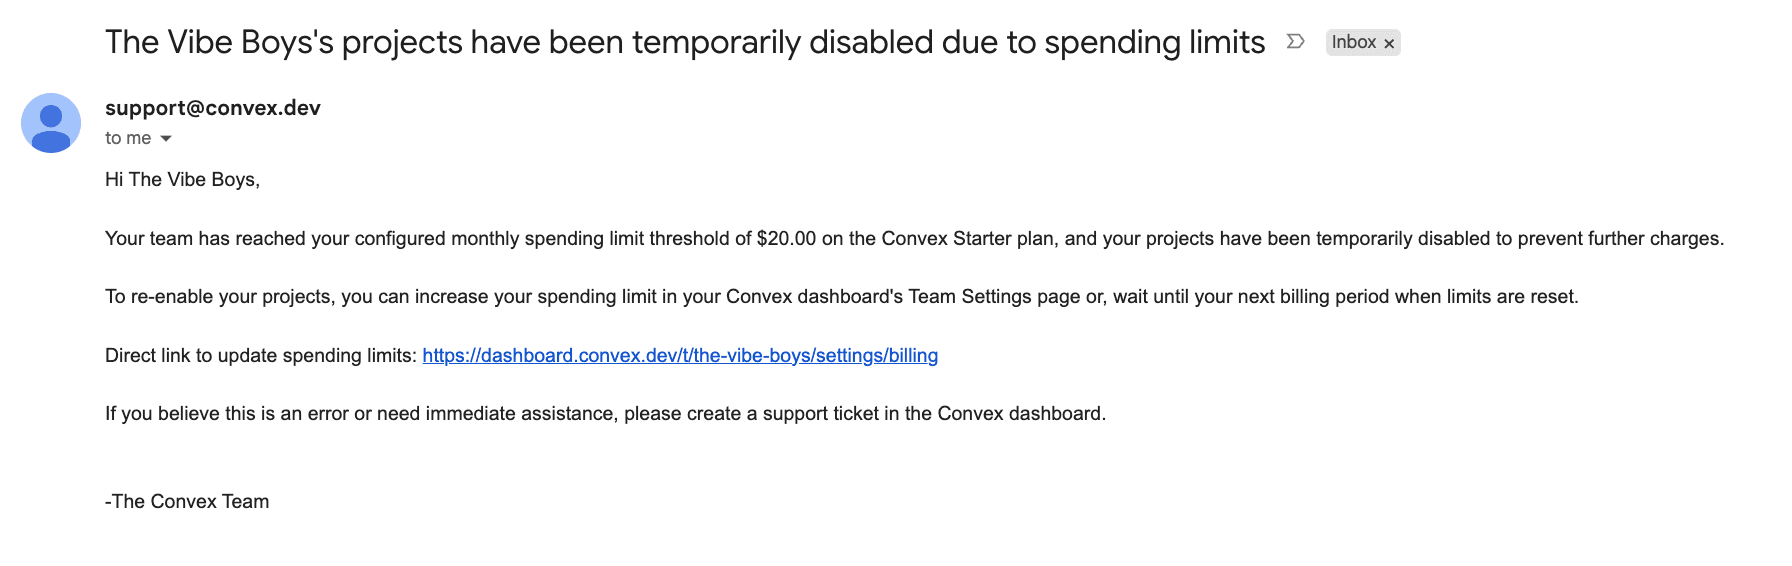
We are on the Convex Starter plan with a configured $20 monthly spending limit. The database I/O spike incurred approximately $38 in overage before Convex temporarily disabled both our development and production projects. The guardrail prevented the cost from growing without bound, but it was not an instantaneous stop at exactly $20.
The tradeoff was availability. Raising the limit to $50 did not immediately bring the projects back. We even ran a controlled 97-second test without the cap, with our dispatchers stopped, and the projects remained disabled. We restored the limit, contacted Convex support, and waited. The deployments eventually came back without a support response or a precise reactivation timestamp. That is why fixing and deploying our code was not enough to end the outage immediately.
GitHub Actions slowed the recovery deploy.
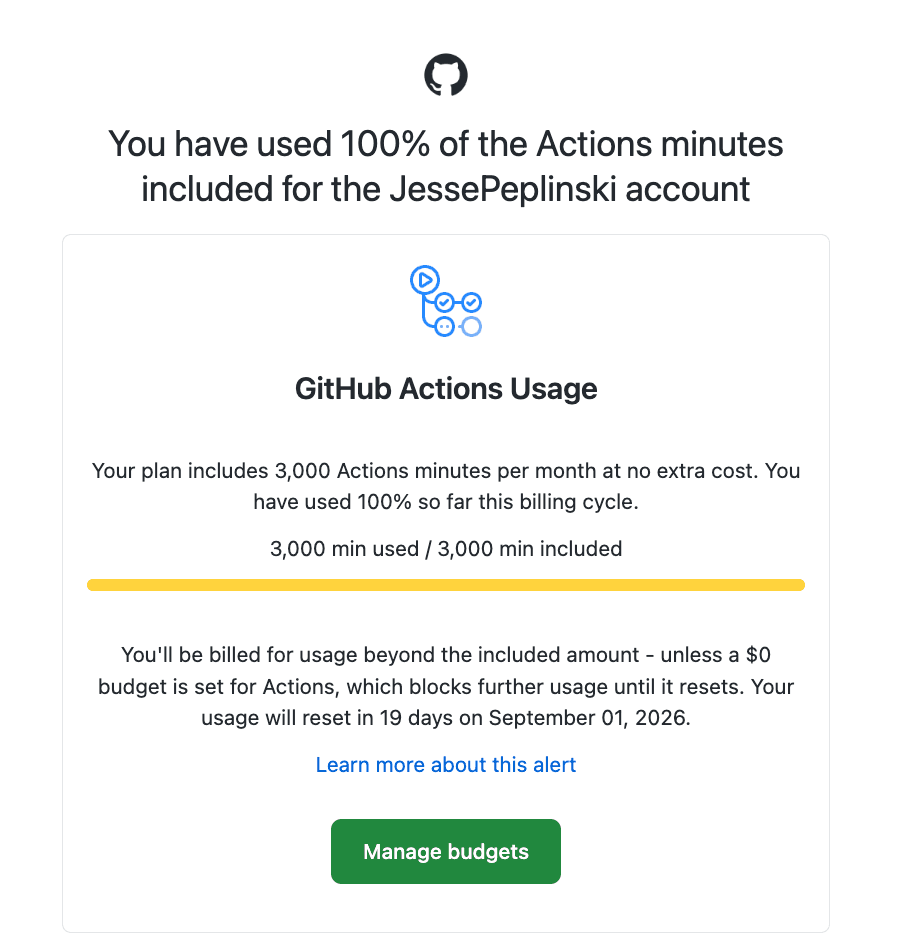
At nearly the same time, GitHub Actions reached 100% of our included monthly minutes. Because the account had a zero-dollar Actions budget, GitHub blocked additional workflow usage. That did not cause the customer-facing outage, but it initially prevented the verification and deployment workflow for our emergency fix from running.
We updated the GitHub Actions budget, reran the pipeline, and then promoted the fix through development and production. This also happened one day after a separate OpenAI prepaid-credit incident stopped post generation. The three limits were separate failures, but together they made the recovery path much noisier than it needed to be.
How we fixed the underlying problem.
We paused the heavy Admin Jobs view, replaced the global historical job feed with an indexed and bounded active-job summary, restored the runner heartbeat from five seconds to 30 seconds, and added a one-minute backoff when dispatchers find no work.
Once Convex re-enabled the projects, queued work recovered. We smoke-tested sign-in, the main dashboard routes, social connections, the post composer, and the job queue in production. The expensive admin queries did not resume their earlier growth.
What we learned and what changes next.
The first lesson is that an internal dashboard is still production code. A convenient live view can become expensive when it reacts to frequently changing records, so operational screens need the same indexing, pagination, and query limits as customer-facing features.
The second lesson is that spending limits are useful safety controls, but they are not exact real-time budget ceilings. Hitting one also becomes an availability incident. We need alerts well before usage reaches the shutdown threshold, plus a documented reactivation path when it does.
The third lesson is that a successful deploy is not the same as a recovered service. We are adding external uptime and outage tracking, CloudWatch alarms for runner and Lambda failures, earlier database and GitHub Actions usage alerts, and end-to-end canaries that confirm users can sign in and jobs can complete. The full Admin Jobs history will remain paused until it can be rebuilt around paginated, on-demand reads.
The final lesson is that availability has to be continuously measured, not assumed. We cannot promise that a dependency will never fail, but we can make sure an outage is detected immediately, recorded with an accurate timeline, communicated clearly, and recovered through a tested incident runbook instead of waiting without knowing whether service has returned.
Current status.
TryLaunchLoop is operating normally again. Core production flows and background processing have been verified, the database I/O protections are live, and a new $50 monthly spending limit remains in place.
We are sorry for the interruption. This incident exposed a real gap in both query design and operational monitoring, and the immediate containment work is already in production. The next step is making detection much faster so a similar failure cannot stay invisible for hours.